


14 km SW of Pitaloza Arriba, Panama
2026-10-09 17:56:08 UTC
33.0 kmA visual snapshot of current earthquake activity: recent volume, stronger events, active countries and M4.5+ clusters.
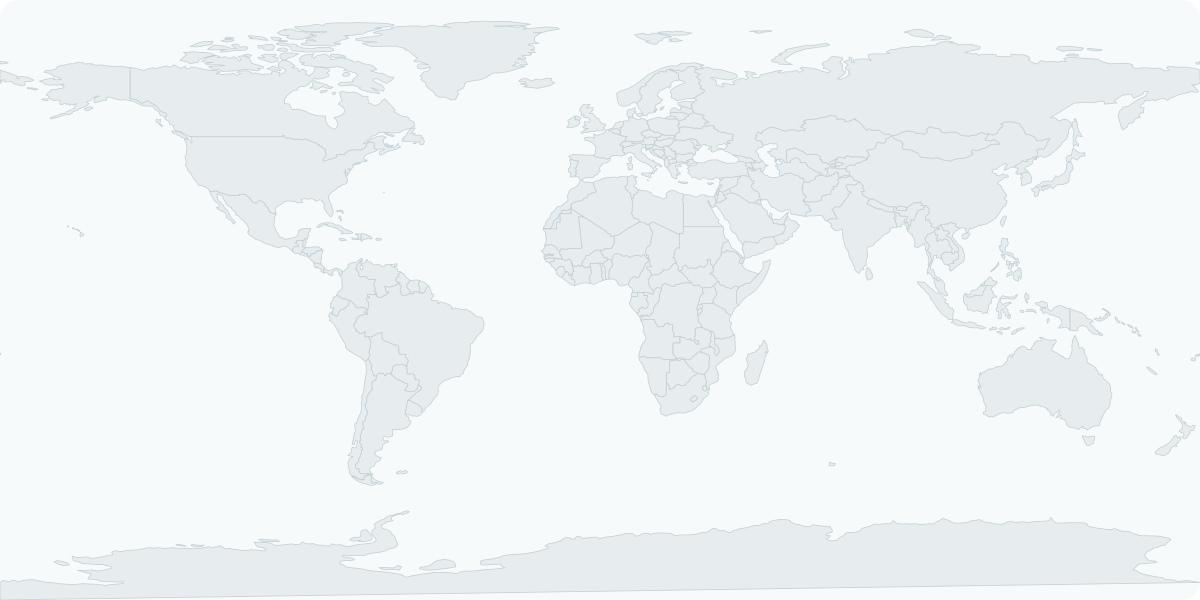
Each bubble represents a 10° grid cell containing at least one M4.5+ earthquake during the selected period. Bubble size follows event count; intensity follows the strongest magnitude.
Last 72 hours
M4.5+ · Last 30 days
Last 30 days · M4.5+
Last 24 hours
2026-10-09 17:56:08 UTC
33.0 km2026-10-09 17:56:06 UTC
12.6 km2026-10-09 20:25:40 UTC
10.0 km2026-10-09 20:25:39 UTC
10.0 km2026-10-09 14:49:41 UTC
10.0 km2026-10-09 18:37:46 UTC
10.0 km2026-10-09 18:22:15 UTC
10.0 km2026-10-09 13:51:42 UTC
10.0 kmAn automated selection based on magnitude, reported impact, tsunami flag, PAGER level and USGS significance.
2026-08-20 18:00:18 UTC
38/1002026-08-15 10:54:51 UTC
38/1002026-08-14 22:28:37 UTC
38/1002026-08-14 21:58:21 UTC
72/1002026-08-10 12:34:28 UTC
100/1002026-08-08 04:50:34 UTC
41/100These visualisations describe the Quake Pulse database. They do not predict future earthquakes or measure local hazard. Long-term comparisons are more robust at higher magnitudes.
Latest event : 9 min.
Guides, explainers and practical reading to go beyond the live data.

Magnitude is only one part of the story. Depth, distance, local ground conditions and building vulnerability help explain why shaking can differ so much from one earthquake to another.
Read article →
Earthquake-resistant design is not about making buildings immovable. It is about controlling forces, deformation and failure so people have a much better chance of staying safe.
Read article →
Early-warning systems detect an earthquake after it starts and try to send an alert before the strongest shaking arrives. The difference between warning and prediction matters.
Read article →